Prometheus Metrics
Feature state: stable
Automated metrics collection on Kubernetes
Avisi Cloud Kubernetes comes with a fully managed Prometheus monitoring solution, providing robust observability tailored for the unique needs of Day-2 operations. By utilizing Cortex, an open-source project under the Cloud Native Computing Foundation (CNCF), Avisi Cloud Observability ensures that your metrics platform is both reliable and scalable.
Key Features
- Automatic Deployment: Prometheus is deployed within your cluster without any manual steps required, fully managed by Avisi Cloud.
- Long term Storage: Your metrics are stored safely in secure and highly available storage and remain available, even if your cluster is down.
- Prometheus Operator: Utilizes the Prometheus Operator, enabling the use of
ServiceMonitorandPodMonitorresources. - Unified Alert Overview: Manage and view all your Prometheus alerts in one place.
- Simplified Alert Silencing: Silence alerts conveniently via CLI, API, or the Avisi Cloud Console.
- Centralized Alertmanager: Effortlessly manage your Alertmanager configuration in one central location.
- Secure Metrics API: Access your metrics securely through an API with OIDC based authentication.
- Grafana Integration: Visualize your metrics data with ease, using Grafana for comprehensive insights.
Long term storage
Metrics are stored in a secure and highly available storage.
Alerts & Silences
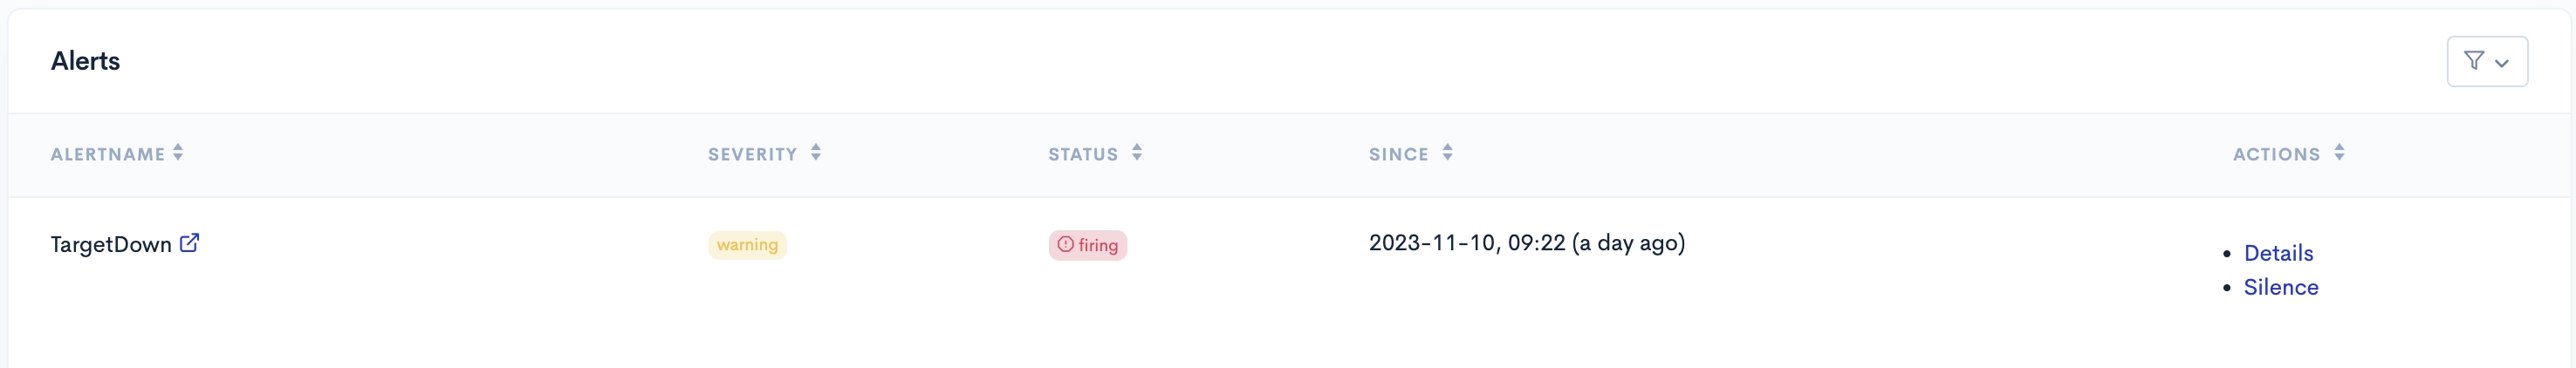
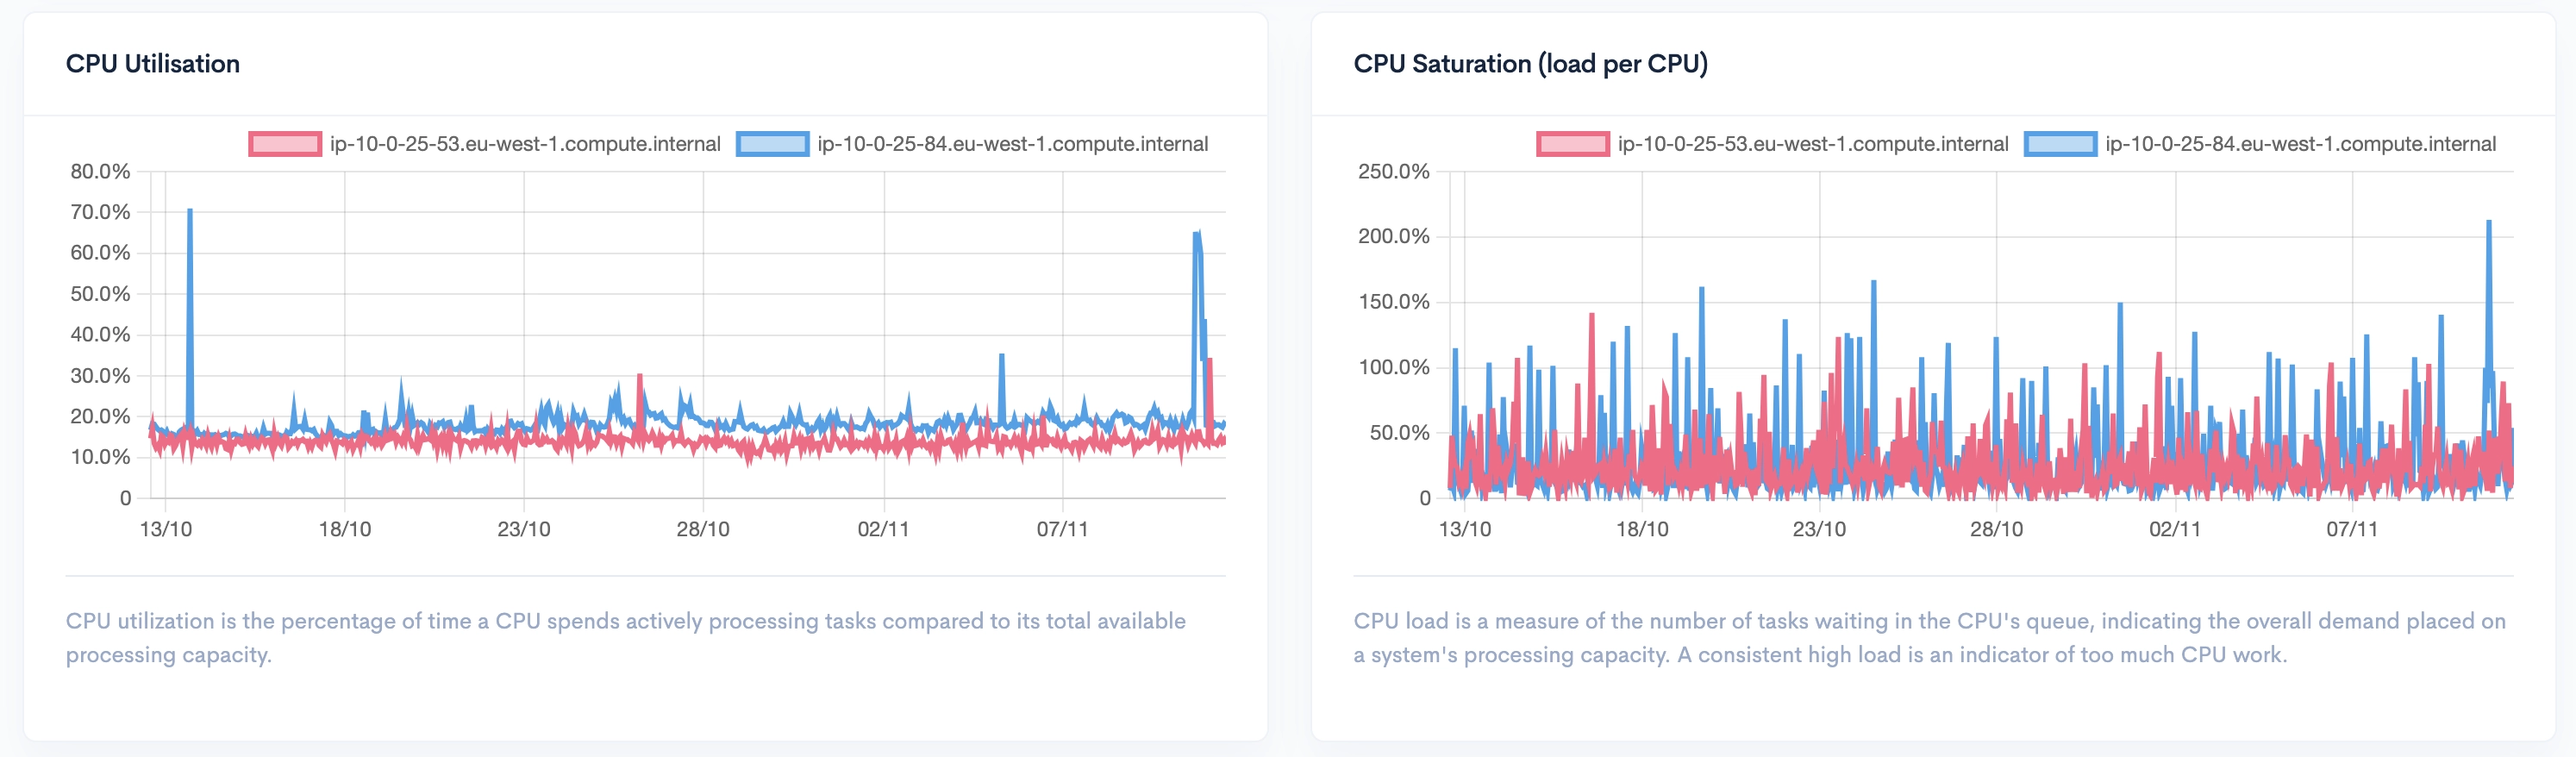
Prometheus Alerts are visible in an overview, per cluster and across your entire organisation.
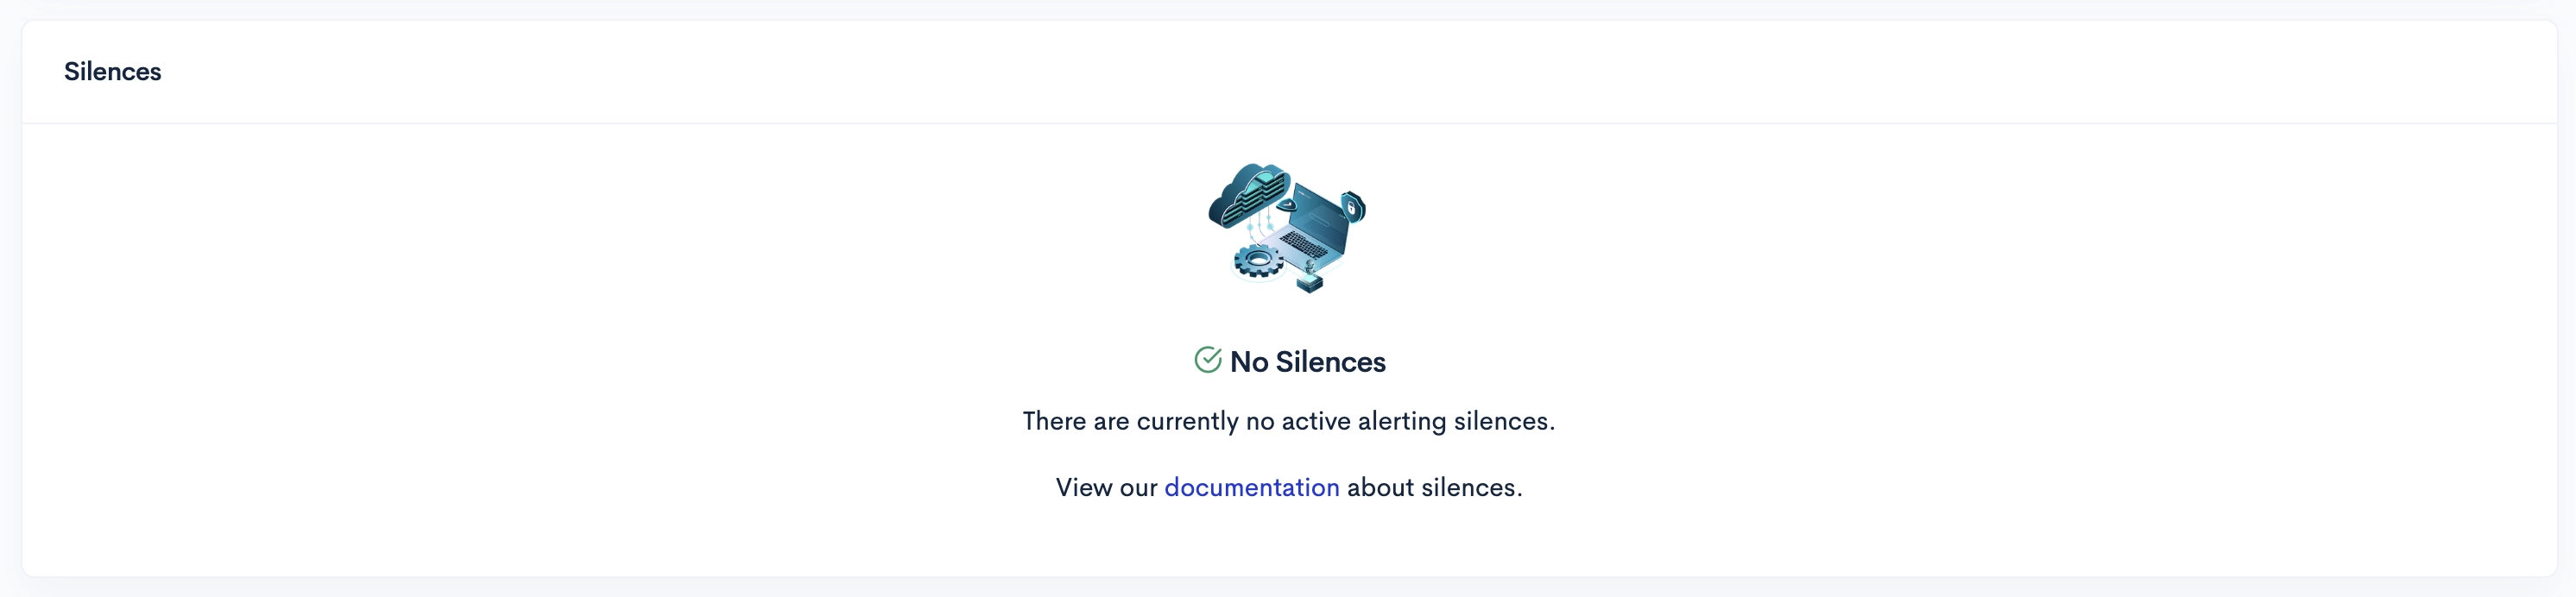
Alerts can be silenced in order to avoid spamming your notification channels during maintenance or other actions.
Getting Started
Getting started with Avisi Cloud’s Hosted Prometheus is easy:
- Create a new Avisi Cloud Kubernetes cluster, or use an existing one.
- Enable the Metrics AddOn through the Avisi Cloud Console or API.
- Access your metrics data through the API or visualize it with Grafana.
Overview
What is Prometheus?
Prometheus is an open-source monitoring and alerting toolkit widely used by many organizations and projects. It collects and stores its metrics as time series data, meaning each metric is stored with its timestamp and optional key-value pairs called labels. Through this, Prometheus allows for flexible queries and real-time alerting.
Prometheus is used for monitoring systems by configuring jobs to scrape metrics from specified endpoints. These metrics help in understanding the behavior of the system and in setting up alerts to notify when certain thresholds are crossed, which is critical for maintaining the reliability and performance of software applications.
Prometheus Features
The core features of Prometheus include:
- A multi-dimensional data model: This model organizes data with time series defined by metric name and key/value pairs.
- A flexible query language (PromQL): Prometheus’s query language allows for slicing and dicing of collected time series data to generate insights and aggregations.
- Time series collection via a pull model over HTTP: Prometheus scrapes metrics from target instances at defined intervals.
- Targets discovered via service discovery or static configuration: Prometheus is adept at discovering services to monitor through both static and dynamic means. Avisi Cloud uses the Kubernetes API to automatically discover services to monitor.
Cloud Native Computing Foundation graduated
Prometheus is a Cloud Native Computing Foundation graduated project.