Console Observability
Feature state: stable
Avisi Cloud Console, view your resources directly from your browser
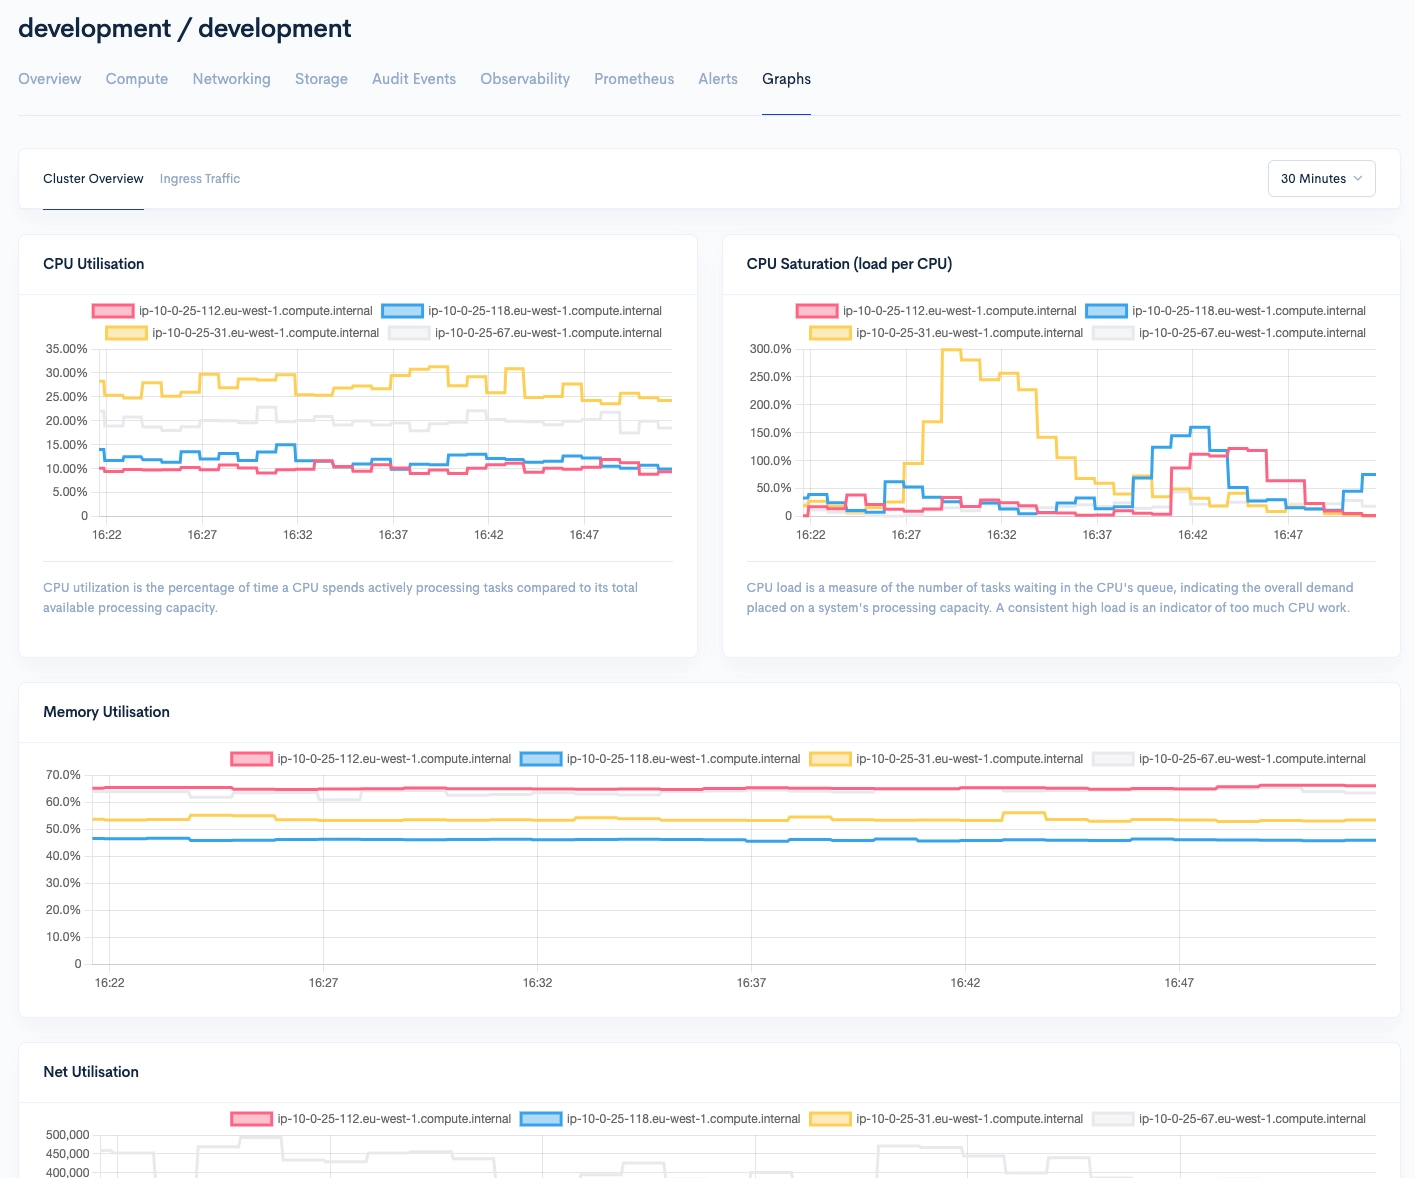
Graphs
By default three graphs are available for any cluster with monitoring enabled:
The CPU Utilization chart displays the percentage that all CPU on a node is used per second for each node within a cluster.
The Memory Utilization chart displays the percentage that the memory on a node is used per second for each node within a cluster.
The Net Utilization chart displays amount of traffic for each node within the cluster.