Overview
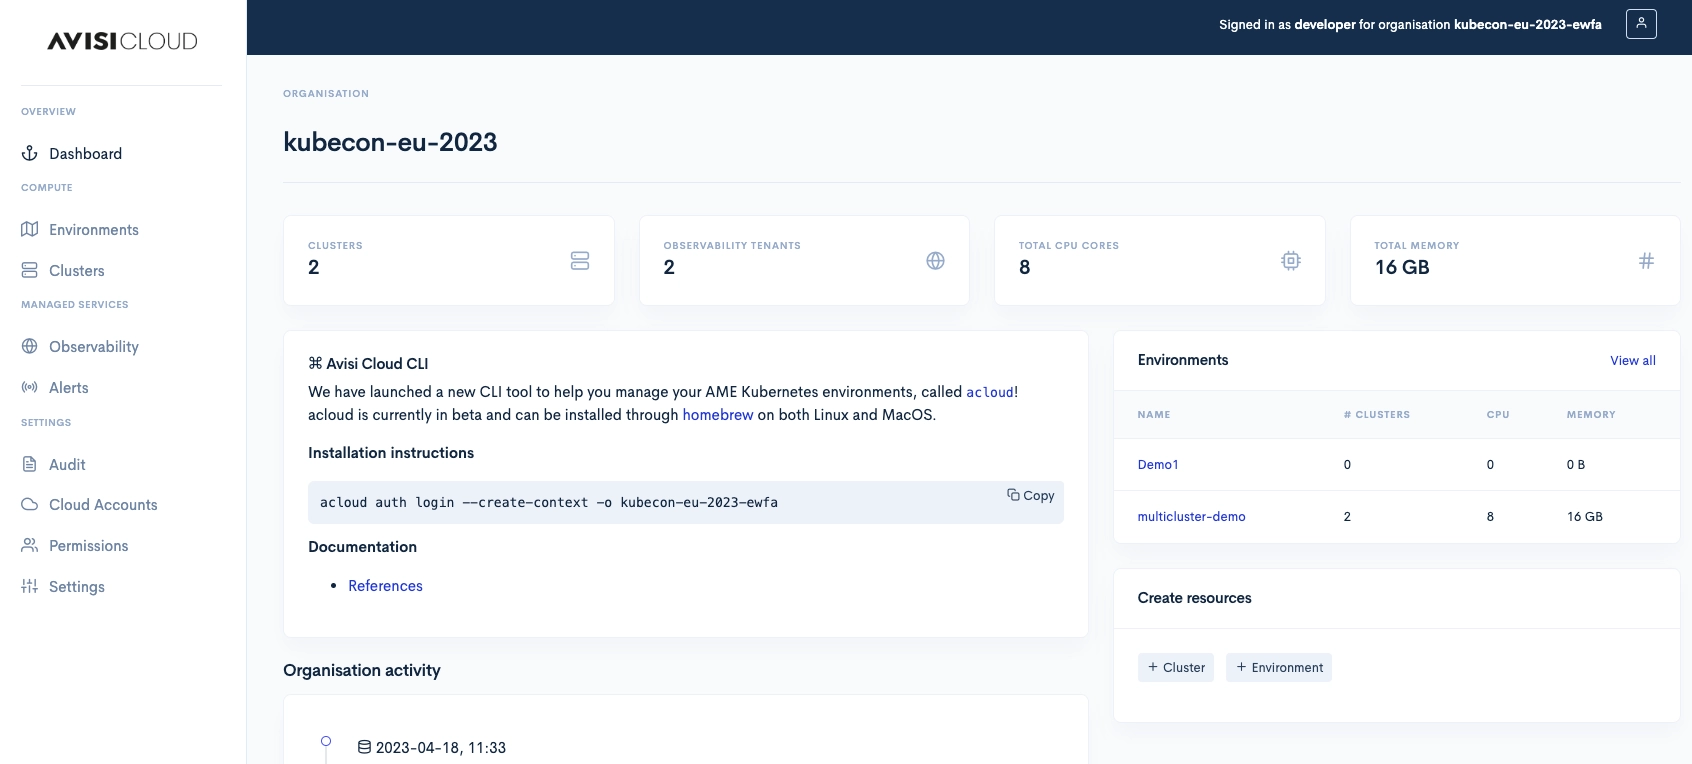
Avisi Cloud Console, view your resources directly from your browser
You can use the Avisi Cloud Console to:
- Manage cluster resources
- Create new environments
- Scale clusters up and down
- Manage our observability tooling
All customers from Avisi Cloud receive access to the Console and can view and manage all products and services hosted by Avisi Cloud through it.

Features
Manage the full cluster lifecycle
You can manage the full lifecycle of your clusters through the Console. Provision new clusters, perform upgrades or simply scale up the resources available to a cluster.
Observability management
Configure Prometheus rules, alerts and alertmanager receivers for your clusters. View active alerts directly in the Console, across any environment and cluster.
The console is a single glass pane for any observability tooling with easy access to additional tooling such as Grafana.
User management & RBAC
Manage your organisation’s users and their permissions to resources.
Audit logging
All actions performed in the console end up in the audit log. Any actions performed through Kubernetes are automatically stored in your log events.
Single sign-on & Social login
Use Single Sign-on to log into your account on all our services. Integrate with Google or Github social login.
Demo
Other documentation
Avisi Cloud Organisations
This section describes how to create and manage organisations on the Avisi Cloud platform.
Posted February 1, 2024 by ‐ 2 min read
Console Kubernetes
Avisi Cloud Console create an view Kubernetes health status from within the Console
Posted October 6, 2020 by ‐ 1 min read
Console Observability
Avisi Cloud Console, view your resources directly from your browser
Posted October 6, 2020 by ‐ 1 min read
Identity & User Management
Manage user permissions from within your Console, configure Cluster RBAC rules
Posted October 6, 2020 by ‐ 1 min read
Overview of all active Prometheus Alerts
Get an overview of all your active Prometheus Alerts in a single place
Posted October 6, 2020 by ‐ 1 min read