How to track Resource Utilization with Cluster Graphs
How to track utilization with Cluster Graphs
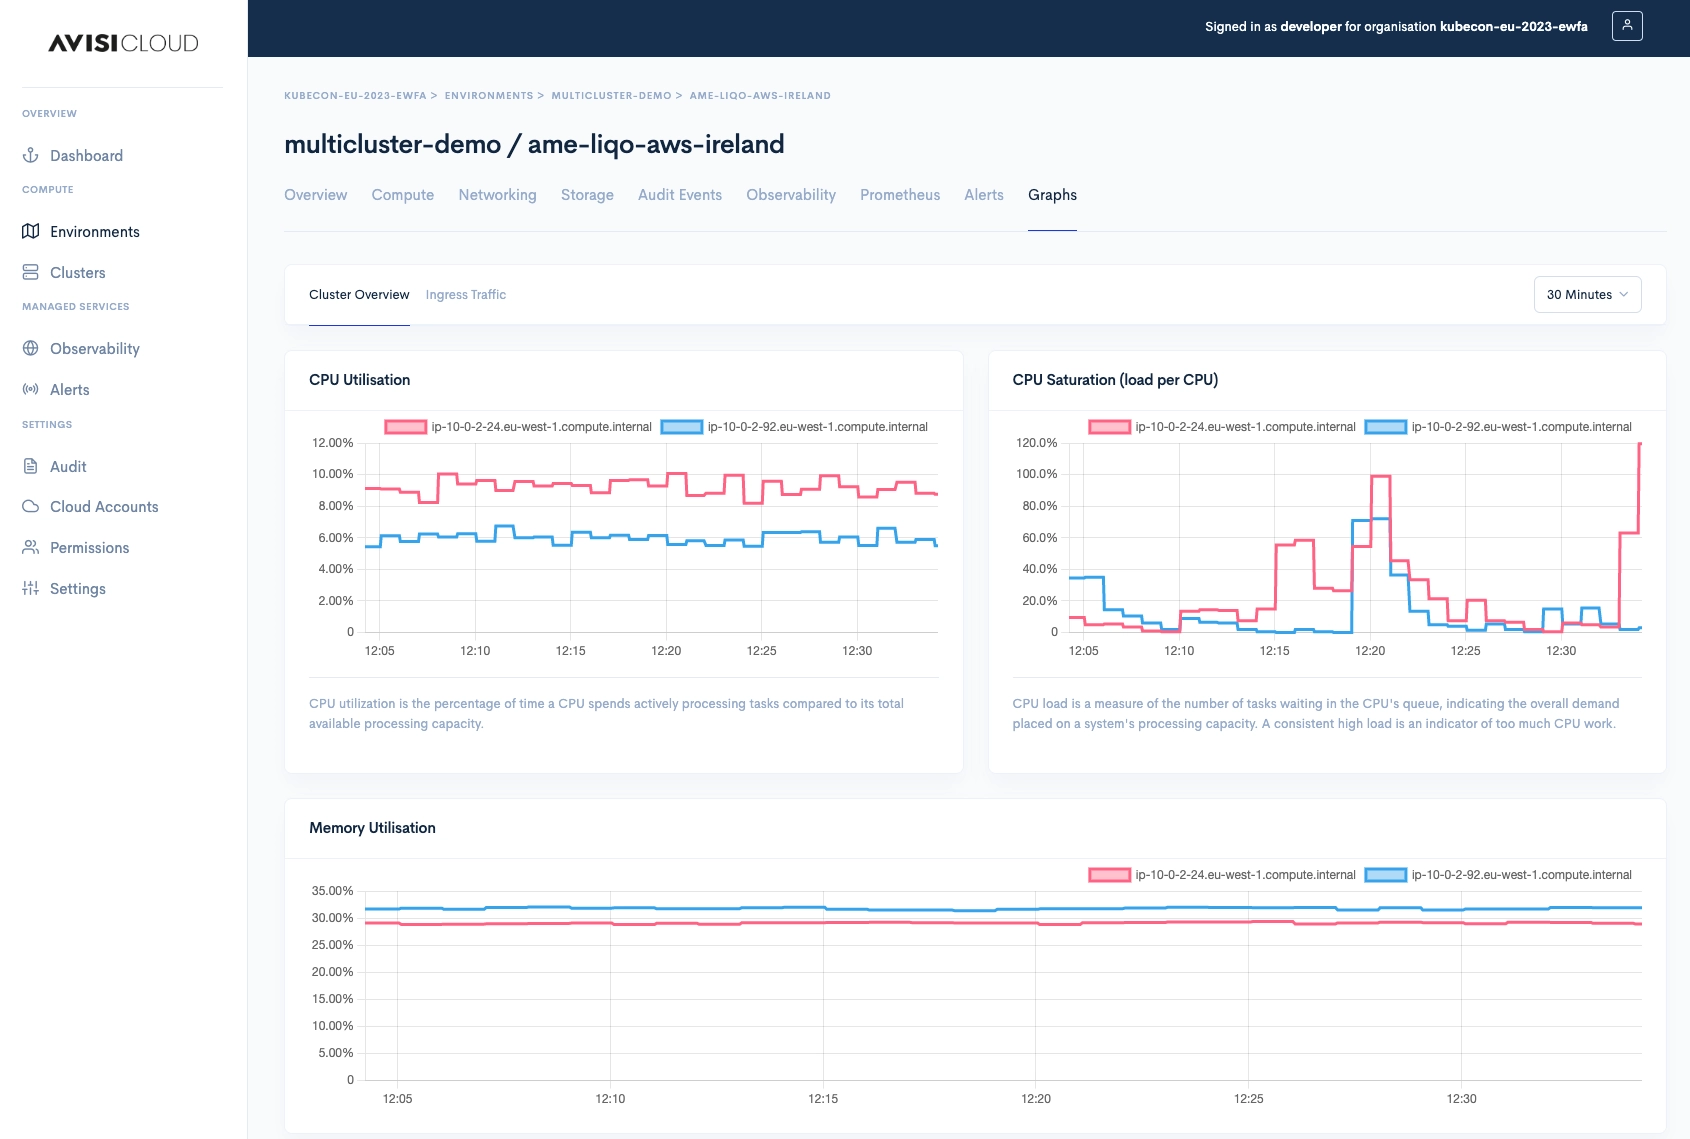
Part of our Kubernetes platform is full integration with Prometheus. Through our Console it is possible to view a basic set of graphs for node Memory and CPU utilization. Each cluster has a tab with Graphs that display this information.
Graphs
By default three graphs are available for any cluster with monitoring enabled:
The CPU Utilization chart displays the percentage that all CPU on a node is used per second for each node within a cluster.
The Memory Utilization chart displays the percentage that the memory on a node is used per second for each node within a cluster.
The Net Utilization chart displays amount of traffic for each node within the cluster.