Improve your Observability with USE and RED methods
Posted May 23, 2023 by Thomas Kooi ‐ 5 min read
Improving observability is essential for any system. Learn how to apply USE and RED metrics to improve your observability and debug performance issues effectively.
Observability with USE and RED
At Avisi Cloud, we run various systems, including Operating Systems, Network Services, Applications, Storage Infrastructure, and other core infrastructure services. In this post, we’ll discuss two methods for observability: USE and RED. By using these methods, you can structure your alerting, debug performance issues, and determine which metrics are essential for a specific piece of software.
USE Method
The USE (Utilization, Saturation, and Errors) method is a strategy for performing a complete check of system health and performance. It aims to help you understand resource usage, bottlenecks, and errors.
- Utilization: This refers to the amount of time a resource was busy servicing work. High utilization can lead to saturation.
- Saturation: This refers to the amount of work a resource has to do that exceeds its capacity. Saturation can be considered a measure of queued or delayed work and is an early indicator of performance degradation.
- Errors: These are the count of error events. This can be anything from system errors, application errors, or user errors.
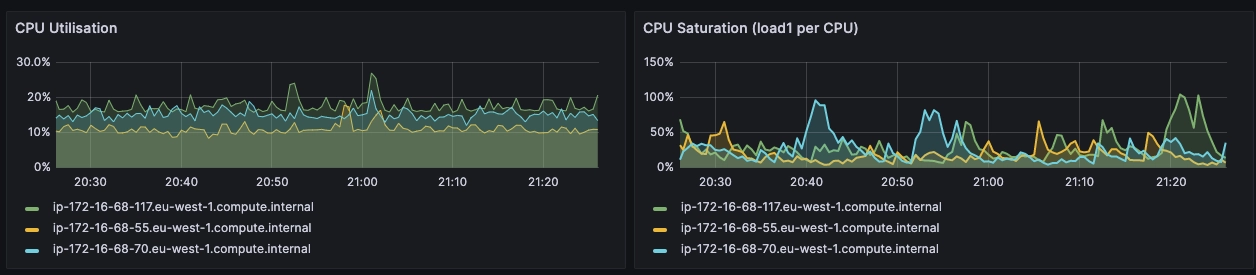
This method is typically used at the host level (or node level in Kubernetes) to diagnose issues related to resource usage.
For instance, utilization, as a percentage over a time interval, can represent a disk running at 90% utilization, saturation as a queue length could represent CPUs having an average run queue length of four, and errors as scalar counts could indicate a network interface that had fifty late collisions.
The most useful alerts for USE metrics are when usage as a percentage goes above a certain threshold or available space on a finite resource drops below a given threshold. Saturation of a given resource above an acceptable level, such as CPU load or page swapping for memory, or errors when accessing a given resource or trying to claim more of it returns an error, such as page faults for memory or dropped packages for networking.
RED Method
The RED method is more focused on microservices and is typically used for services running in a distributed or cloud environment.
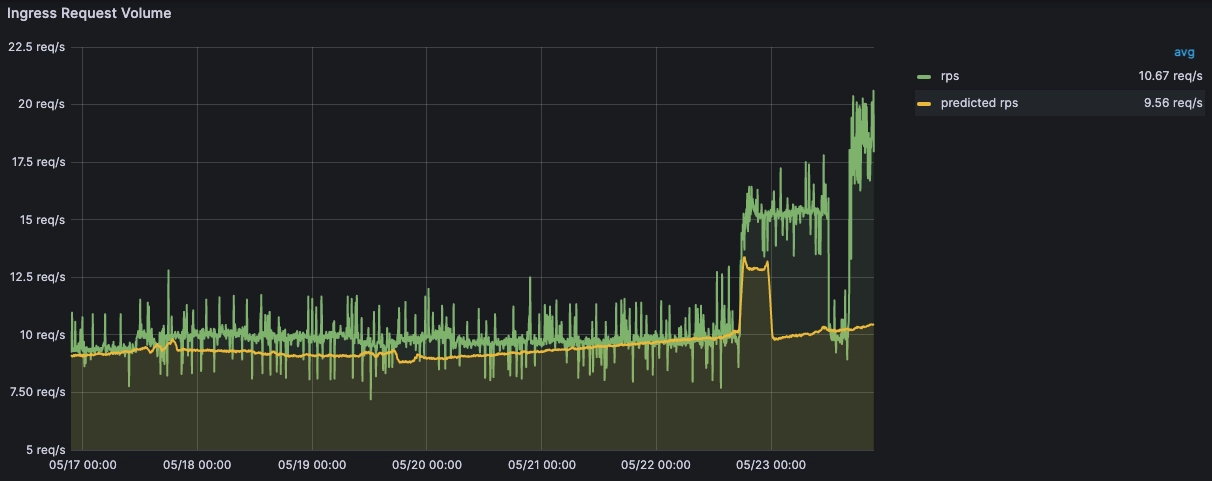
- Rate: This is the number of requests per second that your service is handling. This is often split by the type of request and can be further broken down into successful requests and failed ones.
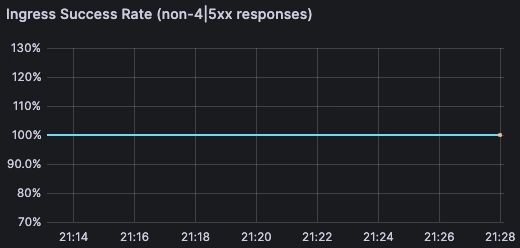
- Errors: This is the number of those requests that are failing, often split by the type of error.
- Duration: This is the amount of time those requests take. These are usually measured at various percentiles (like p50, p90, p95, p99) to understand the full distribution of request times.
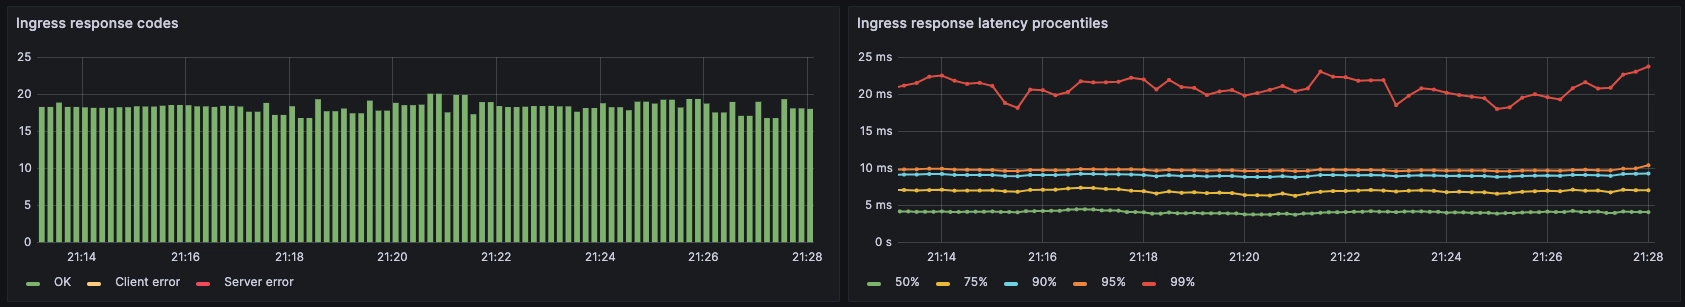
The RED method provides key insights into how well your service or application is performing from the perspective of its consumers.
For instance, rate could represent the total number of HTTP requests processed by an application, errors could indicate the total number of HTTP 2xx and 5xx status codes, and duration could record requests divided between buckets representing a given duration (e.g., 0.1s, 0.3s, 0.5s, 0.7s, 1s, inf+).
The most useful alerts for RED metrics are when the rate of errors compared to the healthy errors is high, or when the rate of errors is above a certain threshold. The former is more suitable for HTTP traffic, while the latter is suitable for any service that during normal operations almost never returns errors. Additionally, you should alert when the duration of requests exceeds a certain SLO. Note that when alerting on durations, always pick a percentile (most commonly; the 99th percentile going above a certain threshold or SLO) to alert on. Using averages will hide problems.
By applying the RED method, you can gain insights into how your applications are performing and where to focus your efforts to improve user experience.
Conclusion
Observability is essential for any system, and by using various monitoring tools, including metrics, logging, and tracing, you can track and understand the behavior of your system. USE and RED metrics are two critical methods for improving observability, structuring your alerting, and debugging performance issues.
Both the USE and RED methods serve to guide observability in different ways and at different levels of the stack, providing a more holistic and informed understanding of system performance and health. They can be used individually or together depending on the specific needs of the systems being monitored.
The USE method is all about resource usage and system focussed. The most useful alerts for USE metrics are when usage as a percentage goes above a certain threshold or when available space on a finite resource drops below a given threshold. Saturation of a given resource above an acceptable level, such as CPU load or page swapping for memory, or errors when accessing a given resource, are also important alerts.
The RED method is all about requests and application focused. These metrics say the most about an application or program and how the user experience is impacted. The most useful alerts for RED metrics are when the rate of errors compared to the healthy errors is high, or when the rate of errors is above a certain threshold. The former is more suitable for HTTP traffic, while the latter is suitable for any service that during normal operations almost never returns errors. Additionally, you should alert when the duration of requests exceeds a certain SLO.
If you wish to dive deeping into this topic, checking the following articles: